Adds new charts, annotations and performance boost module.
Features
- Added Annotations module for annotating a chart with labels or shapes
- Added the Boost module for WebGL rendering of millions of points
- Added the Series labels module for organic positioning of labels next to the data
- Added new series types
- Bell Curve
- Bullet Chart
- Histogram
- Parallel Coordinates Chart
- Pareto Chart
- Sankey Chart
- 3D Scatter Chart
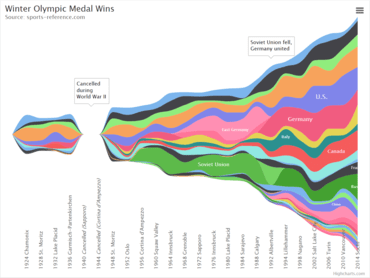
- Stream Graph
- Sunburst
- Variable Pie
- Variwide
- Vector Plot
- Wind Barbs
- Word Cloud
- X Range
- Improved CSV parser of the data module
- Decoupled old IE code into a separate module